Plot
julia
using GLMakie
using DGGS
p = open_dggs_pyramid("https://s3.bgc-jena.mpg.de:9000/dggs/datasets/modis")
a = p[10].ndvi
DGGSArray{Union{Missing, Float32}, 10}
Name: ndvi
Units: NDVI
DGGS: DGGRID ISEA4H Q2DI ⬢ at level 10
Attributes: 18
Non spatial axes:
time 216 Dates.DateTime pointsPlotting is performed on a DGGSArray at a given spatial resolution level. Selecting on non-spatial dimensions (e.g. Time) can be done later on in the interactive plot. Image resolution can be adjusted using the resolution argument of the plot method. Plotting requires to convert the DGGS space back to geographical coordinates. The coordinate transformation is downloaded from a cache server instead of computed if the given resolution is available.
julia
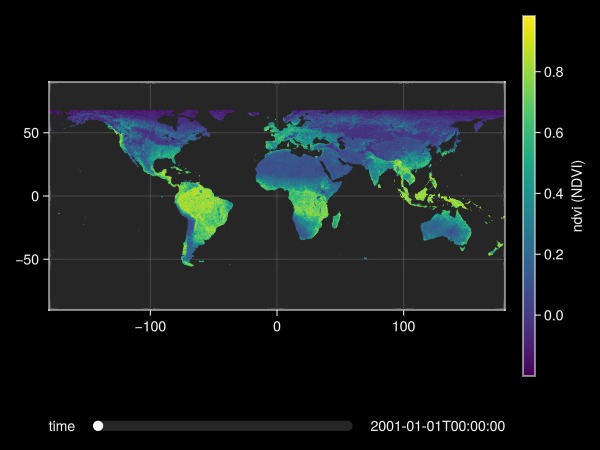
plot(a)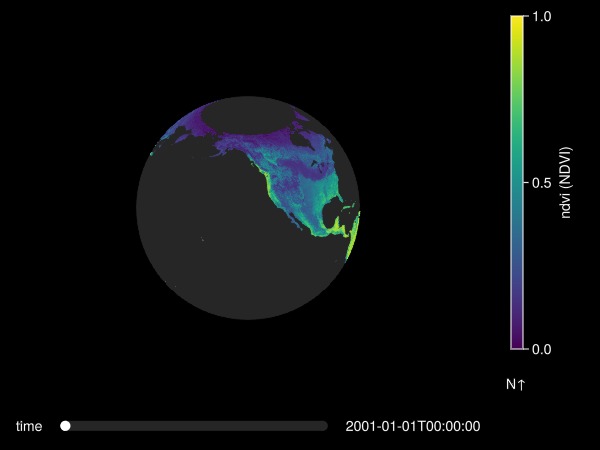
Plot as a map:
julia
plot(a; type=:map)